Skip to content
Wicked weather this way comes

Climate change or “just the weather?” Here’s how to answer that

Some weather extremes are getting worse. Here’s how scientists figure that out.

Scott K. Johnson | 516
Black-and-white satellite photograph of storm clouds over land and ocean.
A fizzling Hurricane Sandy churns over the Northeastern US at night after making landfall in 2012. Credit: NASA/Earth Observatory
Story text

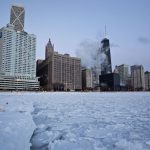
Every once in a while, a day comes along to remind you that weather is more than a trusty source of social lubrication for awkward elevator encounters. Severe weather can threaten property, homes, and even lives. If a statistically rare weather event happens to you rather than someone else, abstract ideas about low probabilities can become concrete, like the way the phrase “broken bone” means so much more when you’re wearing a cast.

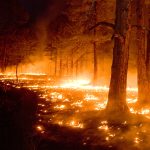
Climate is really just the probabilities of weather, so extreme weather is also the most attention-grabbing aspect of a region’s climate. Thus, climate change includes a change in the probabilities of many weather extremes. As a result, each individual disaster now triggers a natural question: did humanity’s history of greenhouse gas emissions make that disaster more likely or worse?

It’s an inherently complex question for scientists to answer and gives people who reject climate science rhetorical room to loudly argue that you can’t prove climate change was solely responsible for a storm.

For any storm, that’s both true and completely irrelevant. Climate change’s culpability is not an all-or-nothing proposition.

To make an analogy, the steroid molecule isn’t the one hitting the home run; the baseball player is. A baseball player who starts using steroids almost certainly has hit plenty of “natural” home runs in his or her past. But as their home run tally starts to accelerate, it would be foolish to get caught up in pedantic arguments about whether any particular home run would have happened in a steroid-free parallel universe. If a mundane player begins smashing home-run records, you know your sport has a steroid problem.

Probability

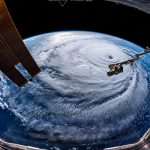
Extreme weather almost always requires that a number of moving parts line up—you may need an unusual amount of moisture in the air at the same time that an unusual pressure pattern guides it in just the right direction. For an event to be extreme, it has to be rare to start with (otherwise you’d call it “normal weather”). So, by definition, it involves some unlucky coincidence.

Climate change alters the conditions in which all these parts are moving. The changes could give the moving parts more opportunities to line up in nasty configurations, or they could raise the upper limit on what’s possible whenever they do.

“I always frame it as a probabilistic statement,” says Oxford University’s Friederike Otto, who studies weather disasters. “Every extreme event has multiple causes, and it will never be the case that climate change is the only reason why an extreme event happened. You can’t say that you developed cancer because you smoked, [but] you can say that smoking increased the likelihood of developing cancer.”

While extreme weather has always existed, some of the extremities will change as Earth’s climate warms. The task in front of climate scientists like Otto is to figure out which weather types have shown measurable shifts in patterns over the last century or so and to tease out the contribution of human-caused warming to those shifts.

Here’s how they do it.

#Trending

A number of scientific reports have summarized this research in recent years: the Intergovernmental Panel on Climate Change’s major 2013 report and a smaller 2012 report specifically on weather extremes, the 2017 US National Climate Assessment, and a 2016 report by the US National Academies of Science.

Each report details what we can say about the observed behavior of various types of extreme weather. Although that sounds like a relatively simple exercise, it’s anything but. First off, you need a long-running record of consistently high-quality data for every type of event you want to talk about. That’s not a huge ask when it comes to daily high temperatures, for example, but records of tornadoes have improved a lot over the years, making apples-to-apples comparisons difficult. And sparsely populated or less-developed regions often lack systematic records going very far back.

Earth-observing satellites gave us revolutionary views of things like hurricanes starting around 1980, making good records a relatively recent development. Because extremes can only be understood through the statistics of weather, you need several decades of data to even start thinking about trends. Satellites alone usually aren’t enough.

All extremes are affected by natural weather variability—noisy wiggles in the data that make spotting a trend harder. Some wiggles are short, meaning they don’t take long to average out. But other natural wiggles tied to ocean circulation are longer—multiple decades, even. This means you need a longer period of data gathering before a trend can become clear.

So even if there was a significant trend in every type of extreme weather, we wouldn’t be able to pick them all out with equal confidence. Sometimes gradual trends can be described with high confidence, while more dangerous trends have to be tagged “low confidence.” Scientific reports try to communicate all of these limitations, but they quickly make for dense and hard-to-read language. That can be a problem when “it’s all a hoax!” is universally a catchier (if utterly ignorant) slogan.

illustration of greater scientific confidence in heat waves and intense rainstorms than in thunderstorms, for example
Climate scientists are more confident about human-driven changes in certain types of weather than in others.
Climate scientists are more confident about human-driven changes in certain types of weather than in others. Credit: US National Academy of Science

Some certainty

Here’s what scientists are the most certain about: heatwaves and heavy precipitation are on the rise. Obviously, warmer temperatures mean more hot days and an uptick in record hot days (while cold records become less common).

You would also expect to see more intense precipitation from basic physics. Warmer air has a greater capacity for water vapor—6 percent to 7 percent more for every 1°C warming—and evaporation also gets a boost from warmth. That allows storms to wring out a bigger, wetter sponge. Beyond that, the condensation of water vapor into rain droplets releases heat that helps rising air keep on rising, wringing the sponge even harder to get all the rainwater out.

We also know that many storm tracks—the common paths that stormy weather patterns inhabit—are crawling toward the poles. That can make for local changes in extremes if a storm track is moving into or out of your neighborhood.

Although you might expect more intense rainstorms to cause an increase in flooding, scientists can’t say much about this, globally. Long-term flood records are spotty and inconsistent, and any potential trends can be masked by both flood-control measures and development that paves land, funneling more rainwater into drainages. We just don’t have clear data to check for a climate-caused trend. (Coastal tidal flooding, on the other hand, is clearly increasing as sea level rises.)

On the dry side of things, drought trends are more complicated. It’s not clear that droughts have increased globally, but some regions do show trends. Although warmer temperatures and increased evaporation will act to worsen droughts, precipitation is increasing in some places while decreasing in others. (Generally speaking, wet places get wetter and dry places get drier.) The region around the Mediterranean seems to be seeing a trend of worsening droughts, for example, while northwestern Australia is trending toward fewer of them.

Since wildfires are linked to dry weather, the story is largely the same there. There isn’t a single global answer, but wildfires in the Western United States have already received a significant boost from climate change.

Thunderstorms producing tornadoes, hail, or dangerous winds are among the most unclear. Tornadoes and hail, especially, suffer from a lack of good long-term data. And because thunderstorms depend on physical processes that are much smaller in scale than the grid cells of climate models, they can’t easily be simulated. That limits researchers’ confidence on how these storms should change in a warming climate.

Storms surging

Storms don’t really get any bigger and meaner than tropical cyclones, also known as hurricanes or typhoons. Because of their destructiveness, the climate change question is virtually guaranteed to come up. When you see entire neighborhoods flooded or flattened—and lives lost—you have to wonder whether some might have been spared were it not for global warming.

We don’t see very many tropical cyclones each year, and even fewer make landfall (and therefore news). So sussing out trends is harder. Roll a die a thousand times in a row and you’ll probably figure out if it’s loaded. But if you’re only able to roll a die a couple dozen times each year, it’ll take you awhile. Making matters worse, tropical cyclone observations before the satellite era were just not that good, so we don’t have that many die rolls to work with.

That leaves scientists primarily focused on studying and modeling the physics of tropical cyclones in a warming world. If certain relationships are nailed down clearly enough, we can be confident they’ll eventually emerge from the noise of our growing datasets.

This is a central prediction, though. Because tropical cyclones are fueled by the evaporation of warm seawater, warmer seawater ultimately should mean stronger storms. That’s pretty intuitive. And in most (but not all) regions, the data already shows an increase in the number of Category 4 and 5 storms.

But there are other complicating factors to consider: stronger upper-level winds would mess up storms and weaken them, for example, and ocean currents could prevent cyclone-forming regions from warming evenly. Researchers have to account for these things when projecting future tropical cyclone behavior.

Whether or not the total number of tropical cyclones will change is less certain. The current understanding leans toward a slight decrease in the overall number of storms, even as the number of incredibly strong ones grows. But in that dangerous context, a small drop in the number of weak storms would be cold comfort.

The category of a storm is based on wind speed, but that isn’t the only measure of a tropical cyclone’s destructive power. Hurricane Harvey, for example, drowned Houston under relentless rain, while the greatest damage from Hurricane Sandy was due to storm-surge flooding as it pushed seawater onto land.

Tropical cyclone rainfall is subject to the same basic physics as other rainstorms. They can contain more water vapor than they used to, so more can be dumped as rain. And again, since the condensation of water vapor releases heat, this can provide an additional energetic boost even beyond the increased water content. Studies of Hurricane Harvey have estimated that climate change increased the storm’s rainfall by 16 or even 38 percent. Harvey sat in place over Houston for days because of high pressures that blocked off its path—freak weather conditions, basically—but it rained harder during that time than it would have in a cooler world.

Storm surge, meanwhile, now occurs on a booster seat provided by sea-level rise. The storm’s winds blow seawater up against the shore, and a higher sea level obviously means that storm surge flooding will be worse. When Hurricane Sandy spun out of the tropics and smashed into New York City in 2012, the storm surge reached farther into the city than it would have a century ago. One estimate showed that more than $2 billion of the almost $12 billion in property damage caused by the flooding could be blamed on sea-level rise.

Some trends are subtler. A recent study found that tropical cyclones have been traveling more slowly than they used to—an intriguing pattern that still needs to be investigated. If that continues, slower storms will have more time to rack up impressive rainfall totals. It also seems that the paths of tropical cyclones are gradually expanding farther from the equator, slowly edging them into areas that aren’t as accustomed to seeing them.

chart showing average tropical cyclone position moving northward in the western North Pacific Ocean
Average latitude of tropical cyclones in the western North Pacific over time.
Average latitude of tropical cyclones in the western North Pacific over time. Credit: US NCA/Kossin et al

So while some human-caused changes to tropical cyclone hazards are quite clear, others are murky. This makes the climate discussion focus a little more on specific aspects of the damage than the storm as a whole. But this also illustrates how scientists analyze the influence of climate change on extreme events—by combining the analysis of past data with simulations of the physics of a warming world.

Credit where credit is due

The science of extreme-weather attribution has matured a great deal over the last decade. Where once scientists simply demurred that a single heat wave or rainstorm could not be connected to climate change, there are now established methods of analysis and reporting. In fact, some researchers in this field are now helping national weather agencies get set up to run these analyses on their own as standard practice.

In addition to answering the immediate climate change question, studies of individual weather events have helped shine spotlights on historical trends—including some that hadn’t been quantified yet. The approach can also disentangle apparent trends that are not due to climate change. If weather observations show something different than the models predict, you can tell there is another factor in play.

“For example,” Friederike Otto told Ars, “in large parts of India, we don’t see an increasing trend in heat waves, which is probably not because there is no trend, but because it’s masked by [sunlight-reflecting aerosol pollution] or changes in irrigation.”

Several years ago, Otto and a team of collaborators organized a rapid event-attribution project, which now commonly releases a report on remarkable weather events within a week or so (for these sorts of computations, a week is rapid). This requires a proven method, the right preparation, and an around-the-clock burst of activity, but it has changed the way these weather events are reported and discussed.

“The question of the role of climate change is always asked, and if we don’t give any scientific evidence then either the question is not answered at all, and it seems that we don’t know anything about climate change, or people answer the question who only have a political agenda,” Otto said. “But if we can provide the evidence, we can show what climate change means in your back yard.”

Rapid response

Here’s how the rapid attribution team generally does its thing.

First off, members of the team have to define what “the weather event” was. Was it a three-day rainfall total for a city? A month-long drought in a specific country? Once they have it defined, they look to the historical data to see how common an event like that has been in the past. They can also see whether there is a trend that is already apparent.

Next, they search long-term climate model simulations for similar rainstorms or droughts. One set of simulations represents the world as it is today, with humanity’s greenhouse gas emissions. If the simulated behavior and frequency of the event matches recent weather data pretty well, the models can serve as a reliable indicator of what’s going on.

A second set of simulations represents the world without all the human-caused changes—as it was in the mid-1800s, for example. The difference between this and the first simulation set shows how much of an effect we expect climate change to have. If the rainstorm in question changes from a once-in-a-century event without humans to a twice-per-century event in a modern climate, the models are predicting that humans should already have caused a trend.

Between the historical data and the model analysis, the team can then conclude whether or not we have good evidence that climate change increased the likelihood of the disaster in question.

In 2016, for example, southern Louisiana received up to 65 centimeters (about 25 inches) of rain in just three days. The method outlined above showed that this incredible rainstorm was probably at least 1.4 times more likely in 2016 than it was back in the 1800s.

chart showing frequency of different amounts of rainfall in Louisiana for a modern climate and the climate of 1900
A 100-year rainstorm in 2016 (red) would be worse than it was back in 1900 (blue) in Louisiana.
A 100-year rainstorm in 2016 (red) would be worse than it was back in 1900 (blue) in Louisiana. Credit: van der Wiel et al./Hydrology and Earth System Sciences

Since this answer is typically being delivered inside a week, there is no time to design and run new climate model simulations—especially since it could take quite a while simply to get your turn on the supercomputers that run these models. That means Otto and her team work with simulations that have already been run. One resource is the collection of simulations that are submitted before IPCC reports, which obviously include simulations of the last century with and without human activities.

But finer-scale regional climate model simulations (as opposed to global ones) are also important for this kind of analysis—preferably with the actual weather patterns that played out around the world. For this, the team relies on a crowd-sourced tool similar to the SETI@home project, suitably called weather@home.

The weather@home model, which has been installed by some 30,000 volunteers (but could definitely use some more), is constantly simulating one month ahead based on forecasts of the slow-changing ocean-surface temperature pattern. That can help separate out the influence of naturally variable patterns like El Niño and La Niña.

As with all research in this field, the rapid-response analysis can’t be done if any of the required components are missing—if the historical data isn’t good enough in that area, or if climate models can’t simulate that type of weather event well enough.

Size matters

Geert Jan van Oldenborgh of the Royal Netherlands Meteorological Institute, who is part of this rapid attribution project, told Ars that small-scale events like tornadoes or hail are beyond their capabilities. He adds that attempts to look at wind storms and droughts have been challenging.

“We just did our first windstorm analysis, but that did not turn out well, with big discrepancies between observed and modeled trends,” van Oldenborgh said. “We concluded that non-climate factors, probably increases in [surface] roughness, were more important than climate change effects. These are currently not included properly in the models.”

“Meteorological drought (absence of precipitation) also is amenable to analysis,” he said, “although it is usually hard to detect trends, as drought is usually only a problem when the variability is large relative to the mean, which usually implies it is large relative to the trend.”

Still, the team’s analysis of the recent drought in Cape Town, South Africa, found that climate change made the drought about three times more likely.

And which events are easiest to evaluate? Temperature extremes and large rainstorms—the weather patterns with the clearest human-caused trends and the most abundant historical data. After all, this isn’t about cooking up some hypothetical simulations based on hunches and then treating their output as fact. Trends with multiple lines of supporting evidence—including the principles of physics—are the ones that climate scientists are confident in. If laboratory experiments tell you rainfall should become more intense with warming, solving the theoretical equations gives you the same answer, and rain gauges out in the world record it happening, you probably understand what’s going on.

Knowing is half the battle

All this tells you how to think about extreme weather. You shouldn’t assume that a day of unusual weather is “proof” of climate change, but a deeper analysis could show that climate change is partly responsible. It’s impossible to rewind the tape and find out whether today’s storm would have happened in a world without greenhouse gas emissions and climate change. On the flip side, every day’s weather is now occurring in a world where the climate has, in fact, changed. We know that has a significant impact on certain types of weather.

The end goal is more practical than just retroactively assigning blame to inform casual conversation. We want to know what kind of future weather we should prepare to survive.

“When an event happens, people are realizing their vulnerabilities,” Friederike Otto pointed out, “and also in the months after an event, there is often a political opportunity to build resilience [and] to do adaptation measures. And if the event that happened is actually an event that is less likely with climate change, or it is a very, very rare event that also stays a very rare event under climate change, then that is as important to know as [when] climate change really is a game changer, and that’s the kind of event you need to adapt to.”

It’s hard enough to ascertain the past range of, say, flash flooding so you know what your new bridge should be built to withstand. Unfortunately, the past is not a sufficient indicator of the future we’ve created. It’s not enough to know that the baseball player is taking steroids; instead, we need researchers to figure out exactly how that player’s hits are changing so we can protect the cars in the parking lot from an increasingly dangerous barrage of home-run balls.

Photo of Scott K. Johnson
Scott K. Johnson Associate Writer
Scott has written about geoscience and energy at Ars as a freelancer since 2011.
516 Comments